Graphical Analysis Physics Lab1
Don Tran
09.04.2022
AP Physics C: Mechanics
Purpose
For this lab, we are going to need to measure the thickness, radius, and mass of each of the 5 disks. To collect the data, we’ll need to collect 5 disks of different radius of the same thickness and material, a ruler/meter stick, and a scale.
For the thickness, because each of the disks are the same thickness, we only need to measure one. We can use the biggest one (because it is the easiest to fold) and fold it 6 times. Then, we can measure the thickness of the disk and divide it by the number of layers (64 layers for 6 folds).
For the radius, we use the ruler/meter stick and measure from the center of each disk to the edge.
For the mass, we weigh each disk on a scale and record their weights in grams.
The precision of the meter stick/ruler was in millimeters. Given the meter stick/ruler, the data is measured all measurements are measured in centimeters with markers representing each tenth of a centimeter which is a millimeter. Therefore the precision of the measurements are in millimeters.
#
Data
Aluminum Disks Radius and Mass
Disk |
Radius (mm) |
Mass (g) |
r2 (mm2) |
|
|---|---|---|---|---|
| Disk 1 (Largest) | 72.2 mm | .72 g | 5212.84 | |
| Disk 2 (2nd Largest) | 52.2 mm | .38 g | 2724.84 | |
| Disk 3 (3rd Largest) | 43.5 mm | .25 g | 1892.25 | |
| Disk 4 (4th Largest) | 31.8 mm | .13 g | 1011.24 | |
| Disk 5 (5th Largest) | 23.2 mm | .07 g | 538.24 |
Graph
Graph 1: Radius vs Mass Quadratic Graph
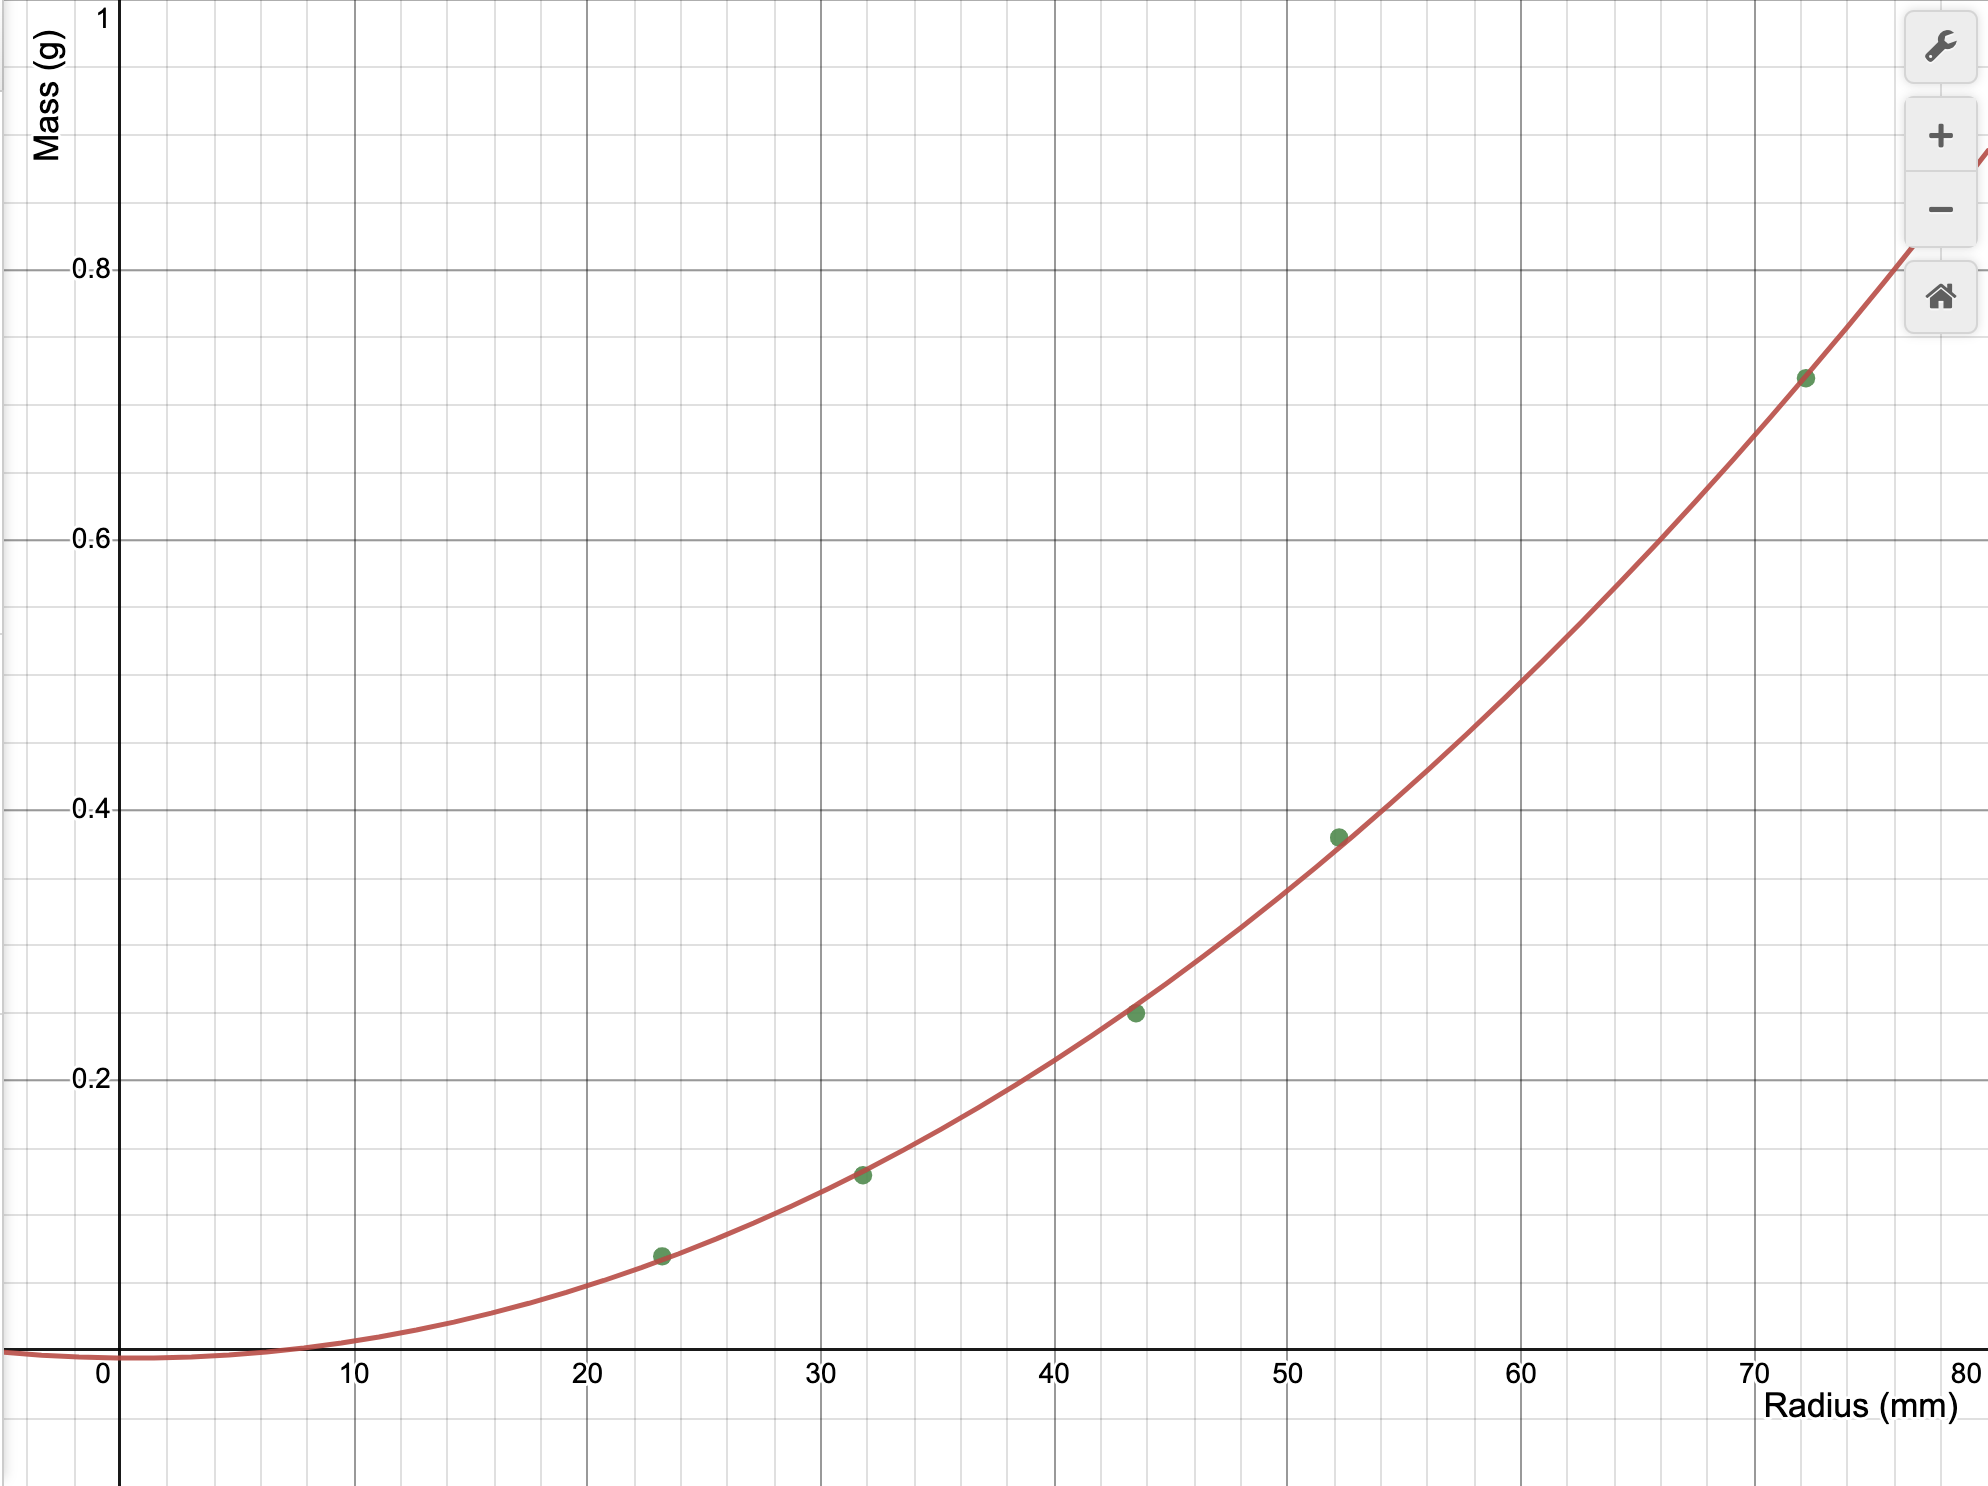
Graph 1 is non-linear because it’s a quadratic graph which shows a clear curve of the data. The equation for the graph is:
(y\ = \ 0.000141609\ x^{2}\ - \ 0.000156579\ x\ - \ 0.00530521)
Graph 2: Radius2 vs Mass Linearized Graph
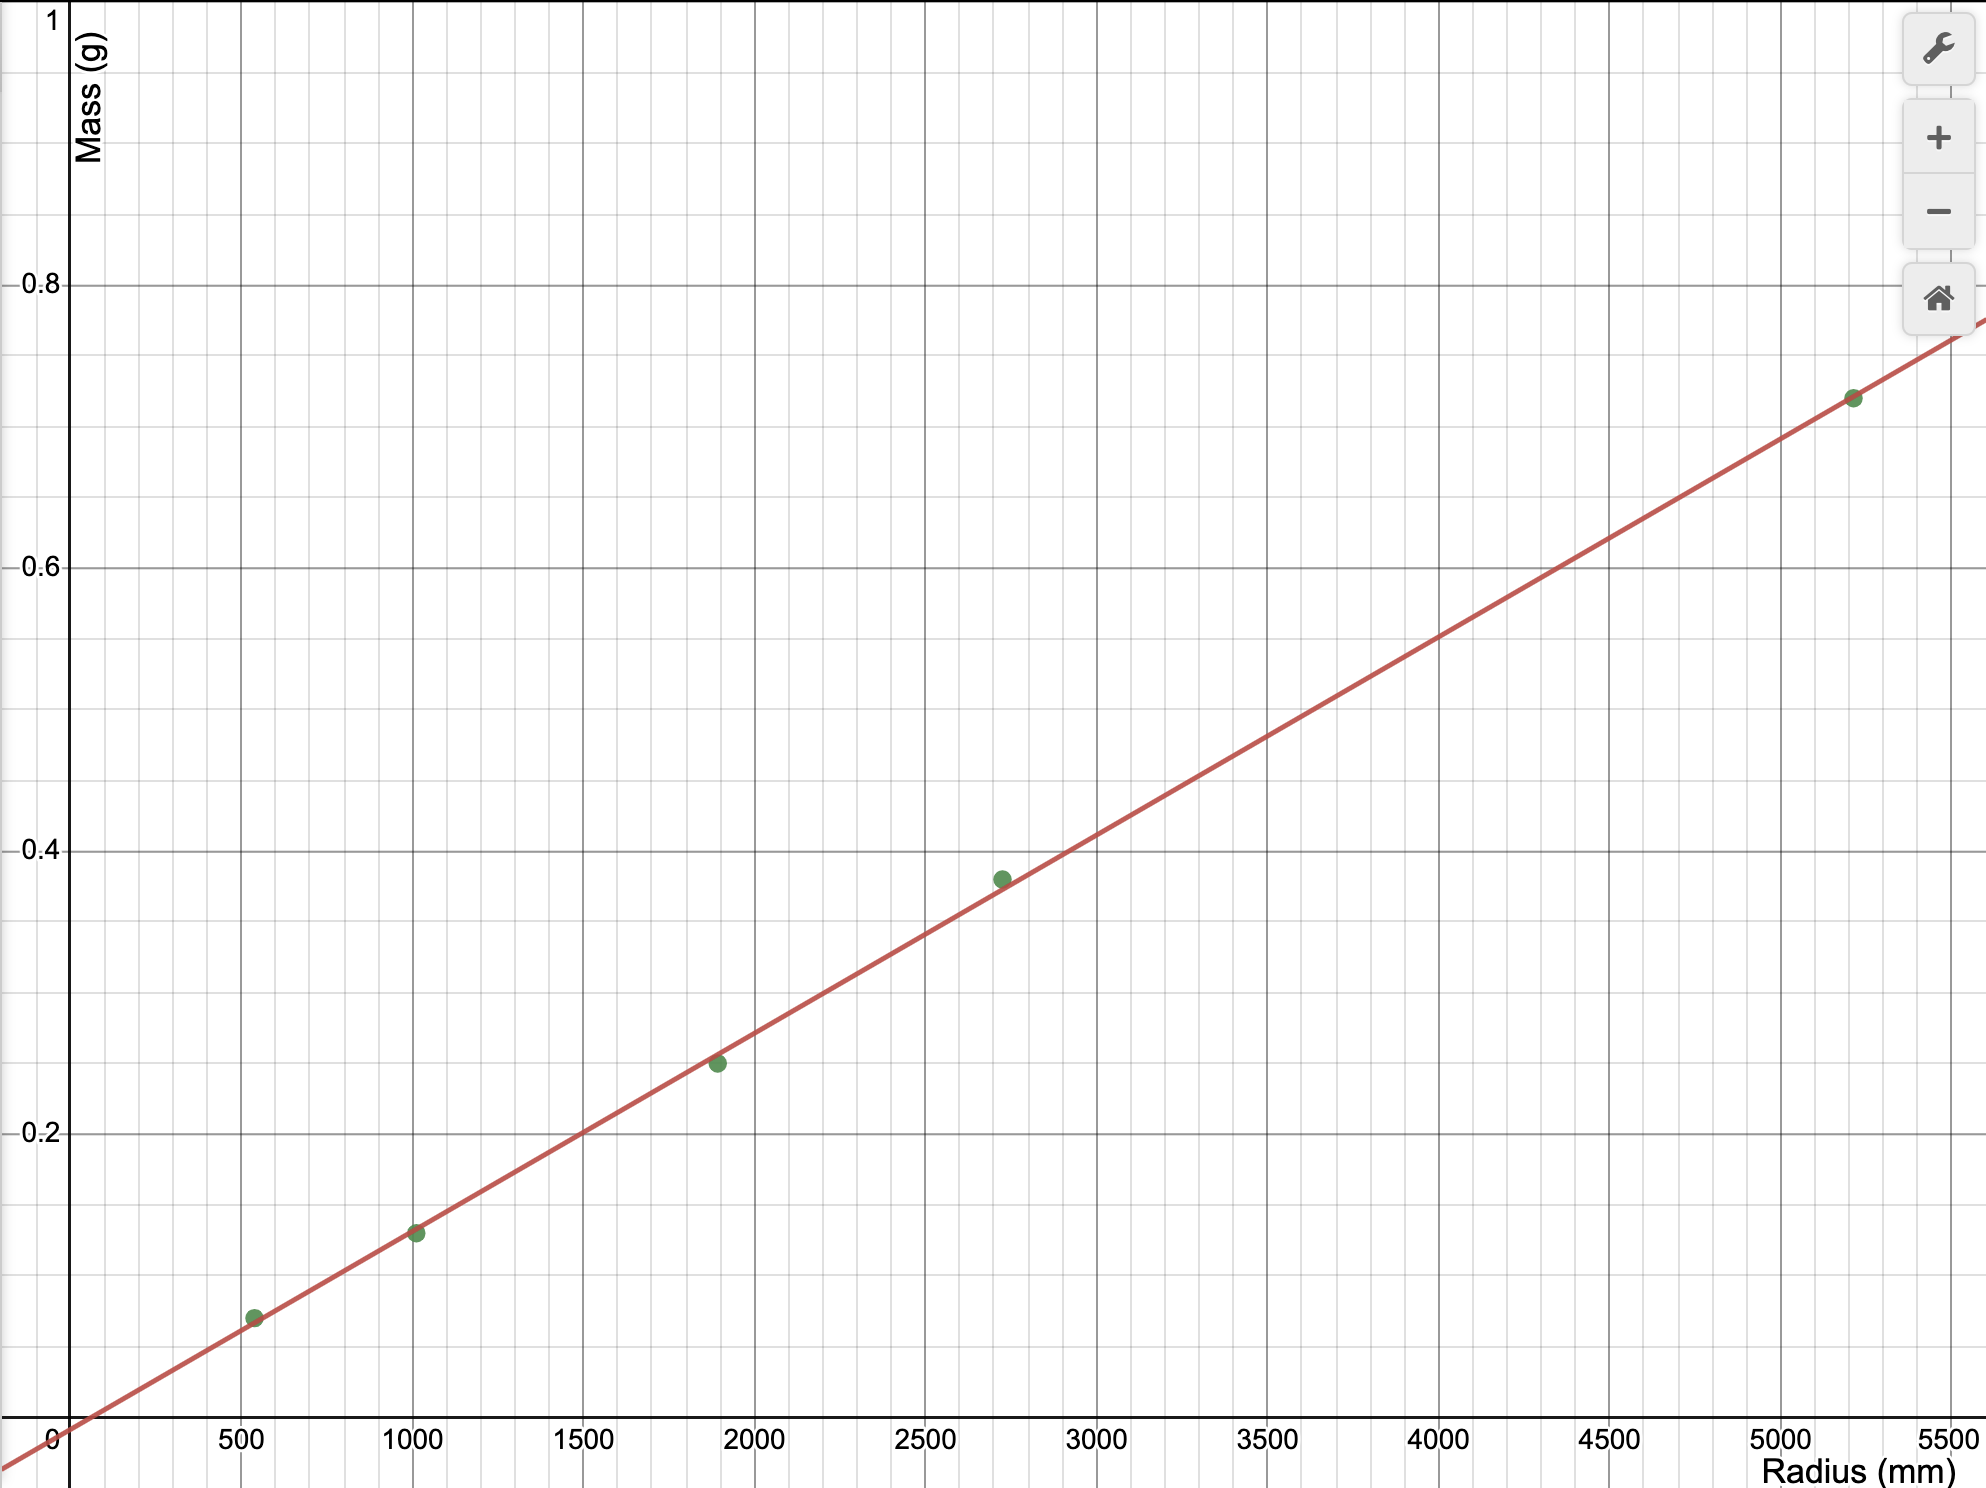
Graph 2 is a linear graph with the equation for its line of best fit being:
y = 0.000140016 (\frac{g}{cm^{2}}) * x - 0.00866072 (g)
Analysis
1) What is the independent variable in your y = mx +b formula?
The independent variable of my line of best fit function is x which represents the value of (r^{2}) of the disks.
2) What does the slope represent in your y = mx +b formula? Show dimensionally that indeed that is what your slope represents and that the formula is valid dimensionally.
The slope in the formula represents (\pi \times \ \rho\ \times \text{\ h}), or pi (which has no dimensions) x density (in g/mm^3) x h (in cm) which is dimensionally measured as (g/cm^{2}). Dimensionally we know the slope is in (g/mm^{2}) and that this equation is dimensionally valid because:
y = mx + b is measured in the units where y is the mass and x is measured in (mm^{2}).
Therefore, in y = mx + b using its dimensions, g = slope * (cm^{2}) + g and therefore, slope = (g/cm) and the equation is dimensionally valid.
3) Should the “b” in your y = mx + b formula be zero? Explain your answer.
No, b in the line of best fit formula should theoretically be zero because if the radius of the disk is 0 mm, the mass by intuition would also have to be 0 grams because the area that the disk covers is nonexistent. Therefore, it is implausible that b should be a negative value because the weight of the disks can’t be negative or any other value besides zero when there is no radius.
4) Measure/estimate the “thickness” of your cylinders. Use that value to find the experimental density of your cylinders. Find a percent difference between your found density and the actual density. The actual material is aluminum.
Cylinder thickness (h): 1/64 mm = 0.015625 mm
(\rho = \frac{m}{V}), (\rho = \frac{m}{\pi r^{2}h}), (\rho\ \times \pi\ \times h = m/r^{2})
(\pi \times \ \rho\ \times \ h = \ slope\ = 0.000140\ \frac{g}{mm^{2}}\ )
(\rho\ = \ 0.000140\ \frac{g}{mm^{2}}\ \times \ \frac{1}{1/64\ mm\ \times \ \pi}\ = 0.002852\ \frac{g}{mm^{3}} \times \frac{1000\ mm^{3}}{1\ cm^{3}} = 2.852\frac{g}{cm^{3}}\ )
Actual aluminum density: (2.7\frac{g}{cm^{3}})
(\% Error\ = \ 100\% \cdot \frac{(Experimental\ - \ Theoretical)}{\text{Theoretical}})
(\%\ Error\ = \ 100\%\ \cdot \frac{2.852\ \frac{g}{cm^{3}}\ - \ 2.7\ \frac{g}{cm^{3}}}{2.7\ \frac{g}{cm^{3}}}\ = \ 5.63\%)
5) errors. Make sure you explain why your number is bigger or smaller than (if positive or negative difference.)
In the experiment, some possible errors might have been due to outside effects such as thermal expansion causing a larger radius compared to the mass, thereby raising the slope value and making the density larger than it actually is. Another possible cause for error might have been imprecise measuring devices when measuring the thickness which was still partly too large to accurately measure, especially given its thinness. One other factor may have been that the disks weren’t perfect circles causing our radius measurements to be overestimated thereby raising the slope value and in turn the density..
Multiple Choice Questions
1. You perform the same experiment, but this time you plot a linear relationship between mass and the circumference of the disks rather than the radius. What is the slope of the linear plot?
A. 4π2 r2
B. 2πr2
C. (h\rho/2\pi)
D. 1/4π
E. (h\rho/4\pi)
(c\ = \ 2\pi r)
c is proportional to r and r2 is proportional to m, therefore c2 is proportional to m. To linearize:
(c^{2}\ = \ (2\pi r)^{2}\ = \ 4\pi^{2}r^{2}\ )
(\rho\ = \ m/v\ \ ), (m\ = \rho v)
(m\ = \ \rho\ \times \ 2\pi r^{2}), (\rho\ = \ \frac{m}{\pi r^{2}h}\ \cdot \ \frac{4\pi}{4\pi}) , (\rho\ = \ \frac{m \cdot 4\pi}{4\pi^{2}r^{2}h}), (\rho = \frac{m}{c^{2}} \cdot \ \frac{4\pi}{h}), (\rho\ = \ \frac{4\pi*slope}{h}), (slope\ = \ \frac{\rho h}{4\pi})
Therefore the slope of the linear plot is h(\rho)/4π. Answer E.
2. SKIP
3. Consider an experiment in which a student measures the mass and diameter of 10 different-sized spheres, all made of the same material of uniform density ρ. For this student to create a linear graph relating the mass of the sphere to its radius r, the student would need to plot mass m versus which quantity:
A. r
B. r2
C. r3
D. r4
E. r1/2
(m\ = \ \varrho v), (v\ = \ \frac{4}{3}\pi r^{3}), (m\ = \varrho \cdot \frac{4}{3}\pi r^{3}), (\varrho \cdot \frac{4}{3}\pi = \ \frac{m}{r^{3}})
Therefore the student would plot mass m versus r3 to linearize the data. Answer: C.
Synthesis Questions
1. In this experiment, if we had used disks with a greater thickness, would the slope of your best fit line have been different? Would your experimental value for density be the same? Explain.
Yes, the slope of my best fit line would not have been different because the greater thickness of all the disks would have caused the mass of the disks to be greater. Therefore, since mass was the y-axis, the ratio between the mass and r2 would have also been greater causing the slope of the line of best fit to increase.
The experimental density would also have been different because the thickness of the disks would have been much easier to measure without requiring us to fold it since folding it still left air pockets that were unaccounted for likely overestimating the height. Therefore, in the relationship between (\pi \times \ \rho\ \times \ h = \ slope) to be more accurate.
2. How would your graph of m versus r2 be different if you had used disks of the same
thickness, but made out of steel? Draw a second line on your m versus r2 plot that
represents disks made of steel.
The graph of m vs r2 would have a much higher slope if the disks of the same thickness were made of steel instead. This is because steel has a higher density than aluminum thereby increasing the mass of the disks and causing the ratio between the mass and radius to be higher.
Graph of Experimental Aluminum Disk Graph vs Theoretical Steel Disk Graph
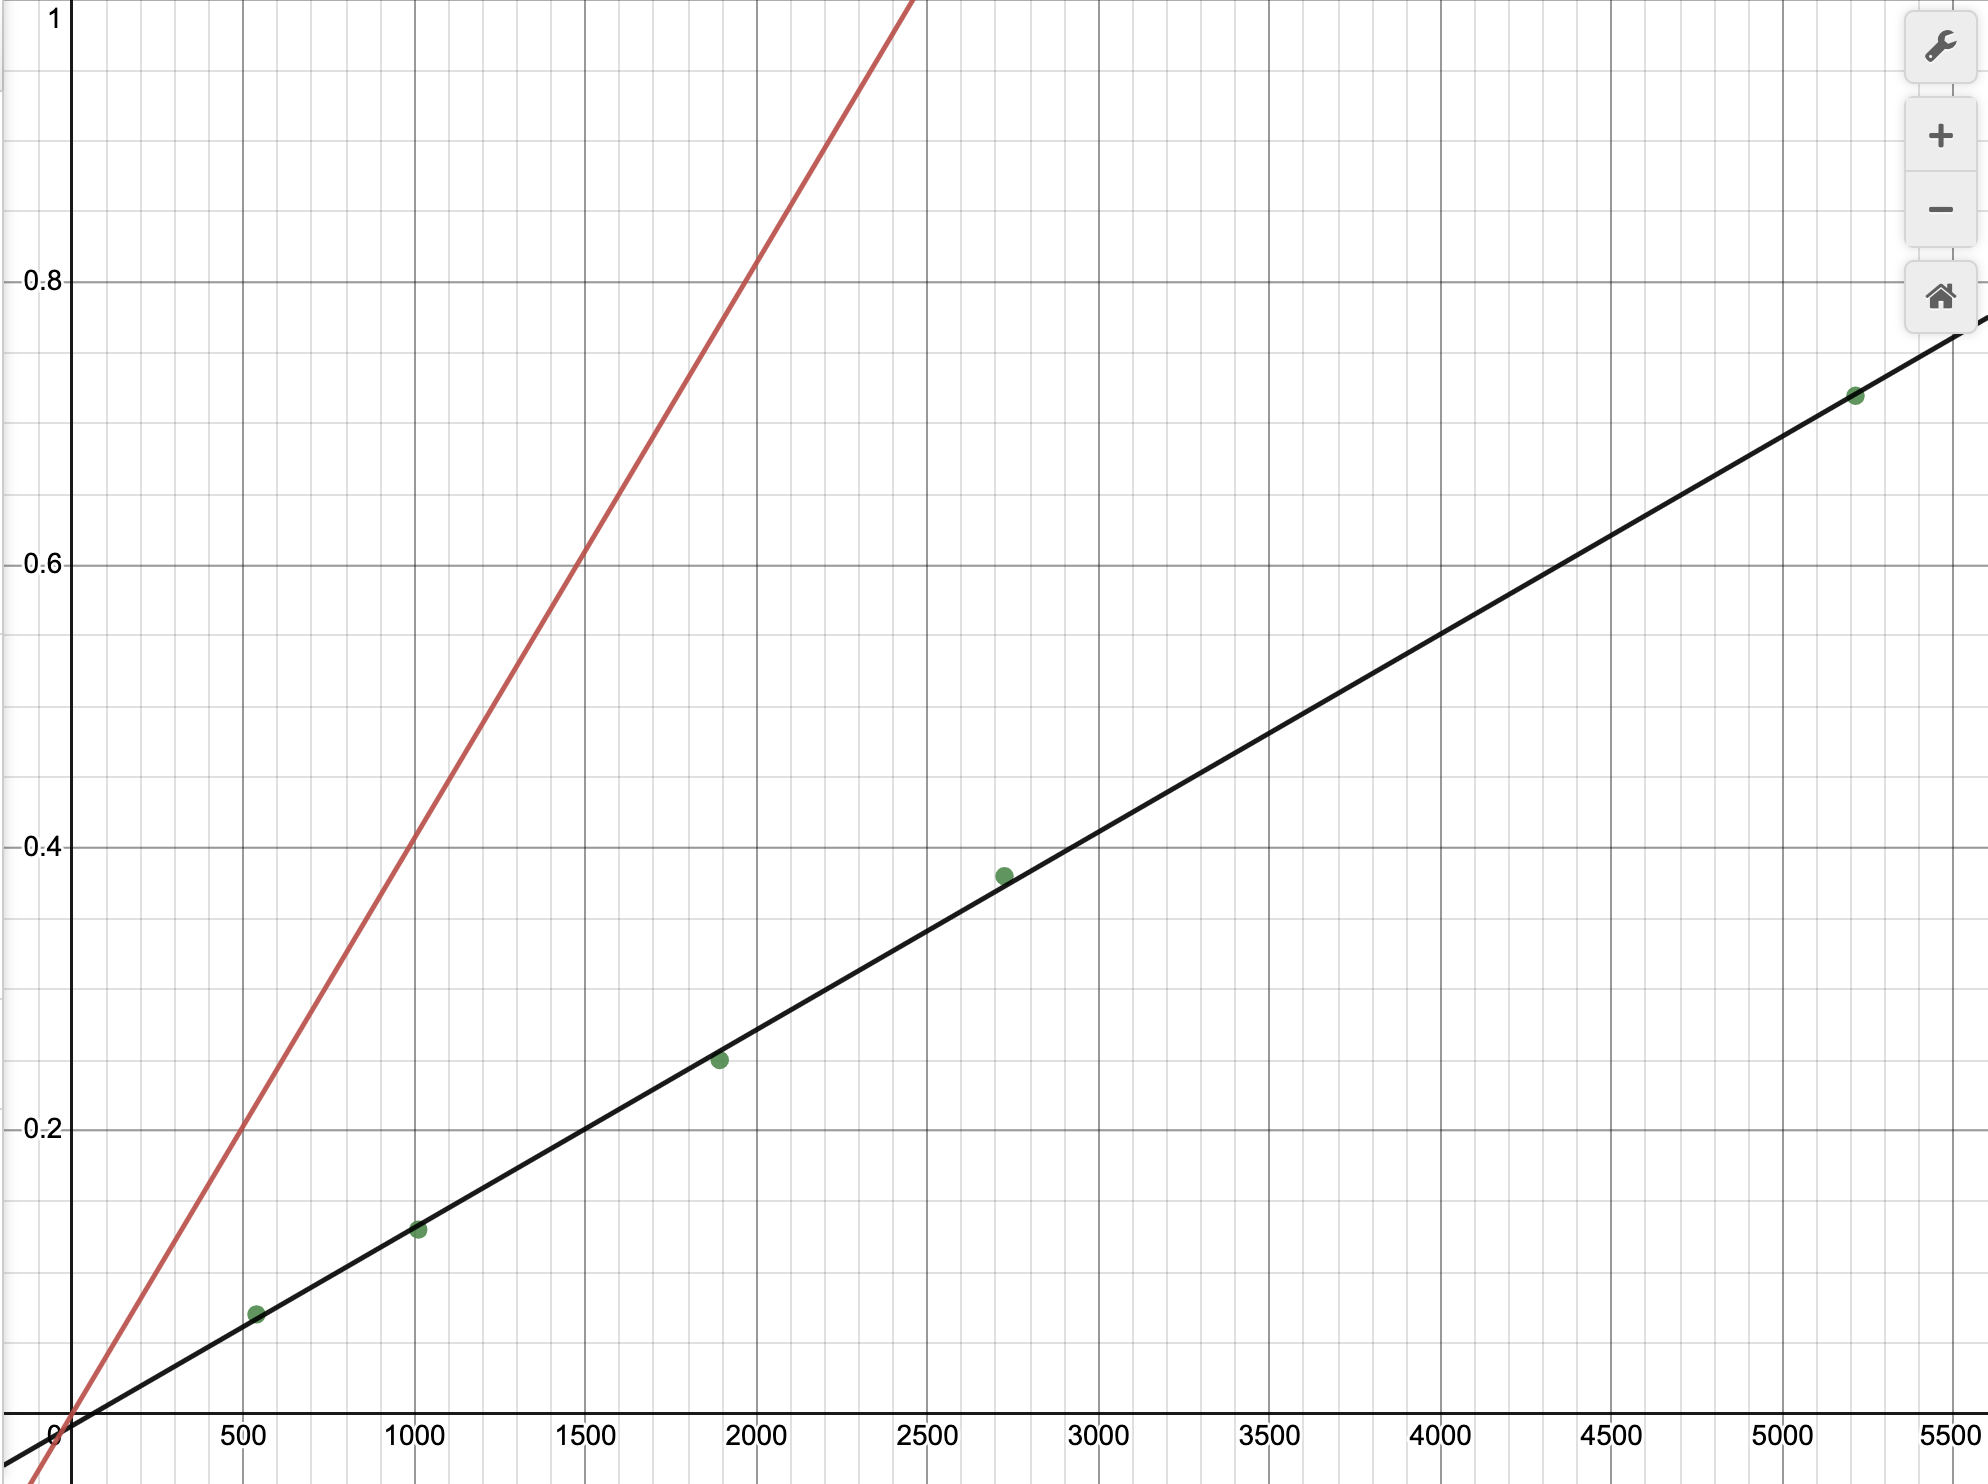
Black represents the line of best fit for the aluminum plates’ m and r2. Red represents the theoretical line of best fit for the relationship between m and r2.
**
**
3. Another group of students has acquired data for the exact same experiment; however, their disks are made of an unknown material that they are trying to determine. The group’s m versus r2 data produced a line of best fit with slope equal to 122 kg/m2. Each disk they measured had the same 0.5 cm thickness. Calculate the density of the unknown material and use the table below to help determine what material their disks are made of.
| Material Density | (g/cm3) |
|---|---|
| Magnesium | 1.7 |
| Aluminum | 2.7 |
| Copper | 8.3 to 9.0 |
| Gold | 19.3 |
| Iron | 7.8 |
| Lead | 11.3 |
| Platinum | 21.4 |
| Uranium | 18.7 |
| Osmium | 22.5 |
(\rho h\pi\ = \ slope\ = \ 122\ kg/m^{2},\ 0.5\ cm \cdot \frac{1\ m}{100\ cm} = \ 0.005\ m,\rho\pi*0.005\ m\ = \ 122\ kg/m^{2})
(\rho\ = \frac{122\ kg/m^{2}}{0.005\ m\ \cdot \ \pi} = 7800\ kg/m^{3} \cdot \frac{1\ m^{3}}{(100\ cm)^{3}}\ \cdot \frac{1000\ g{}^{}}{1\ kg}\ = \ 7.8\ g/cm^{3})
The calculated density according to the student’s data comes out to be equal to that of the density of iron and therefore the unknown material that the disks are made from must be iron.